Nikhil Tailang

Hello, I'm Nikhil Tailang.

I'm a designer and a maker. I'm excited about the role of intelligent machines in shaping our tools for creativity and productivity. Computer programming, faceting gemstones, astrology, hacking plants, pizza, and aeroplanes excite me a lot. I am always up for learning something new. I wish for a world where people are not afraid of technology and live in a symbiotic relationship with technology. I am 13420 days old. This website contains some of my old work.

You may drop me an email at hello at nikhiltailang dot com
Digital ID Cards

Digital ID Cards

to help students manage their attendance

2nd December, 2013   •   Interaction Design and Interface Design.

This is a digital ID card that notifies students of lecture timings and helps them view their attendance performance. By presenting attendance data and lecture schedule through subtle and playful but persuasive messages at the right time, it aims to improve student attendance in classes.

WiFi
RFID
Display


Students and professors are given digital ID cards. The ID card has a display, an RFID tag and an Internet connection. The RFID tag (or the WiFi) is used for detecting a student's presence in the class. This automatically marks the students' attendance. The professor's ID card shows him class timings and students' attendance in his lectures. He can update class timings or add a new class. An animated character on students' ID card shows the updated class time. It also shows a subtle and persuasive message constructed intelligently by analysing patterns in a student's past attendance.

Gamification

Gamification is the application of game mechanics like badges, challenges, leaderboards and levels, to non-game contexts. Here gamification has been used to subtly complement the process of attending classes. Students win badges for completing certain conditions of attendance. These conditions were carefully designed to be more attractive and valuable than simply "attend class".

Badges used in the application

Attendobean

A playful but smart character, Attendobean, was created to be used on students' ID card. It animates, shows time for class to start along with a subtle persuasive message. It is like your friend in your ID card. It even gets upset when you don't attend classes, and jumps with joy when you reach on time.

The messages are designed such that they don't feel like stern and repetitive reminders to be present in the class. The system analyzes data from past attendance to discover patterns created from attributes of classes that a student attends most, and ones that they miss. Using data from past attendance of the entire class it knows which students attend and miss together.

Attendobean therefore knows exactly what message might get you out of the bed on a Thursday morning when there's a Chemistry lab.

Avatars were made for Attendobean to represent emotions and common reasons for absence discovered in research.

Attendobean's avatars to represent conditions. Click / Tap image to see more.

The working prototype…

( Mouseover / tap to get a glimpse of the interaction in the ID card )

Class starts in 2.5 hours

Good morning!

Is an ID card with layers of information

Class starts in 2 hours

How about reaching on time today?

Shows lecture timings and learns your attendance patterns

Class starts in 30 minutes

Some of our friends are already there

Knows that your friends have reached the class but you have not.

Class starts in 15 minutes

Prof. Carlton won't let us in

Knows your attendance records from the past.

You won a daily 50 badge

You were the 50th student to enter the college

Rewards you for positive attendance performance.

Class started 30 minutes ago

That makes it 5 absences this month.

Allows you to notify your professor of your absence.

The Process

The project was done as a part of an academic course on Interfaces and Interactions. We had the freedom to choose an area of interest and work on it. I found an interest in exploring physical presence as a trigger in an user interface. I looked at various places where physical presence matters and at the ways physical presence can affect us. I also looked at how technology and physical presence co-exist.

Technology can't (yet) directly make you physically present, or take away your physical presence at a place. It can however enhance or reduce the effects of your physical presence. Physical presence lets you see more, hear more, do more, use your senses based on external stimuli, at your will. Telepresence heavily filters out the possibility of experiencing everything. If I'm physically present I can choose the things I pay attention to, or the ones that I ignore. Telepresence reduces the field of perception.

After sketching a few ideas where physical presence was of importance, I chose to work on attendance in schools. I started with an aim to make something that would persuade students to attend classes.

1. Survey amongst students and teachers

Common reasons for not attending classes

  • Inadequate infrastructure or teacher doesn't add value
  • Household work or employment
  • Lack of interest of the student
  • Friends not attending
  • Can't wake up on time for early morning classes

Issues faced by teachers in marking attendance

  • Roll calls are tedious
  • Proxy attendance marking
  • Difficult to keep track of attendance in classes with large number of students

2. Literature studies and secondary research

Study of relevant literature

Attendance Improvement Guides published by government agencies.

Public survey report of attendance in schools in India

Guide on collecting and using attendance data

Readings on Persuasive design Readings on Gamification

3. Requirement formulation

Following requirement was formulated:

Need for predefined attendance codes and taxonomy. Ability to communicate absence and its reason. Ability to discover relationships between students who attend and miss together. Create a sense of belonging in the student towards the school, classmates and teachers. Positive recognition for good attendance. Information about availability of teachers. Silent mentoring. Students should feel valued by the teachers.

Ability to automate the process of reliably marking attendance. Motivate students to attend classes.

Sketching possible solutions

Evolution of the prototypes

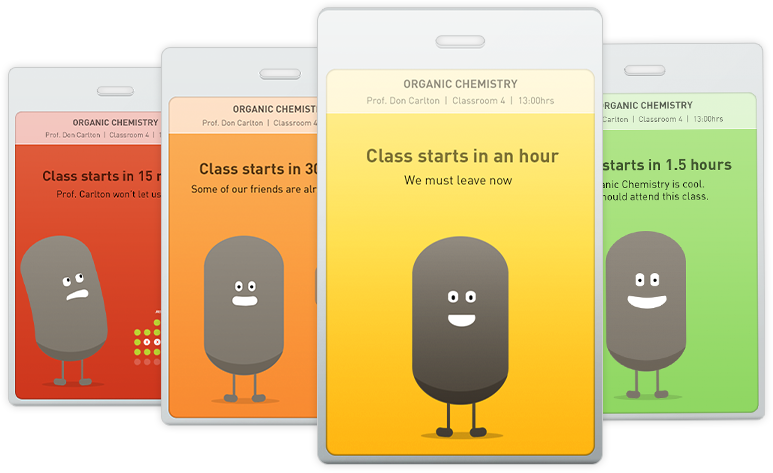
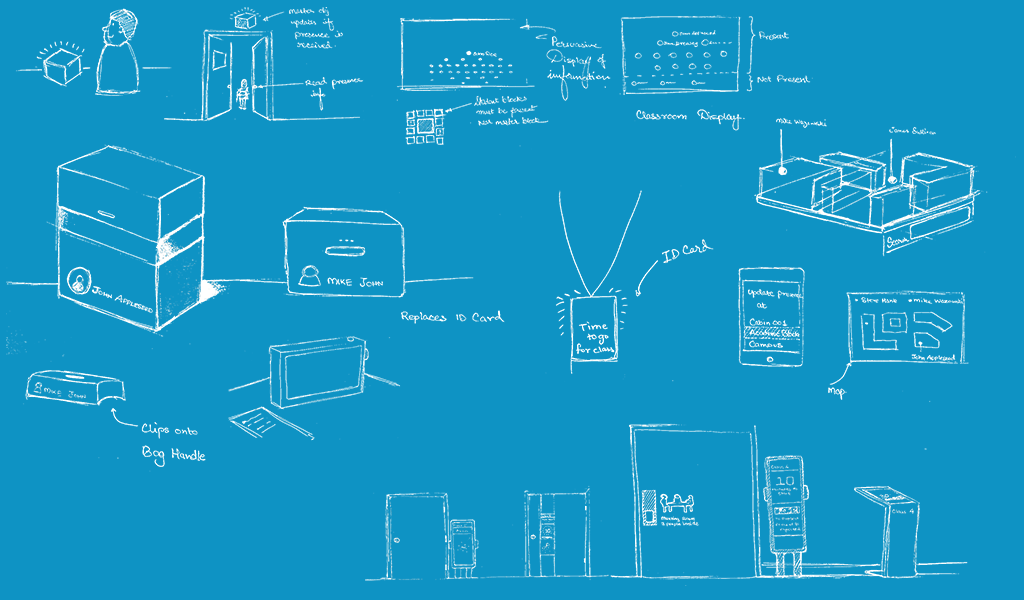
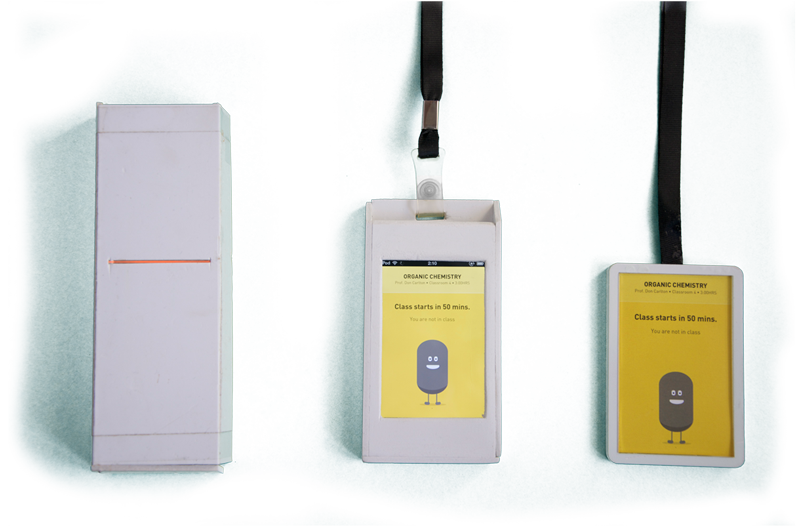
I started with making a device that students would have to carry with them. A prototype for such a device was quickly made using foamcore, an Arduino, an RGB LED and a buzzer. To mark the attendance, it used an RFID card attached to it. It showed time remaining for a lecture by changing colors going from cool blue to warm red. Upon entering the classroom, an RFID reader in the classroom would read the presence of the RFID card and mark their attendance. Sketches were made for variants of this device changing the form. Two main variants were one which was shaped and sized like a marker, and the other being one that was shaped like a clip-on for school-bags.

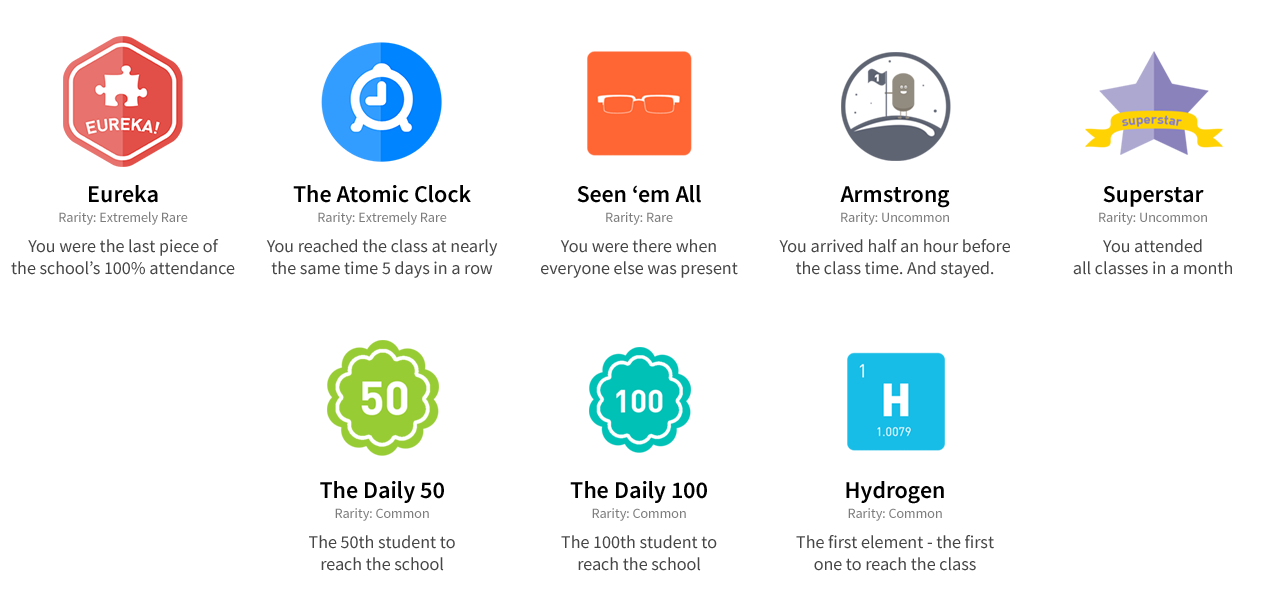
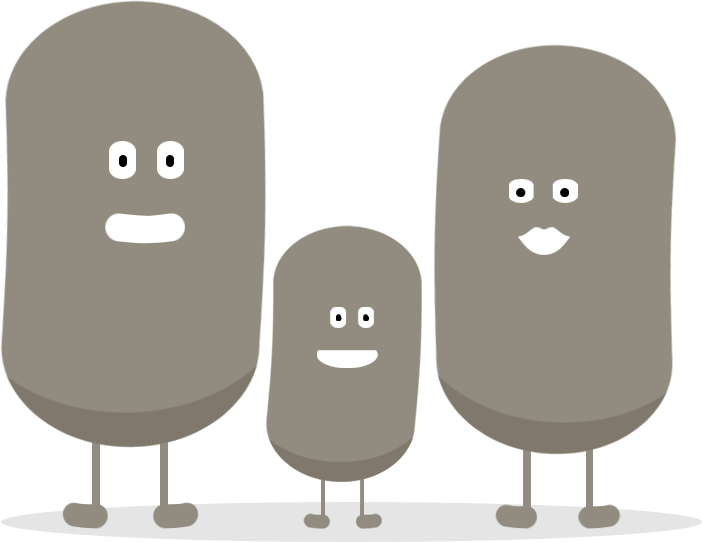
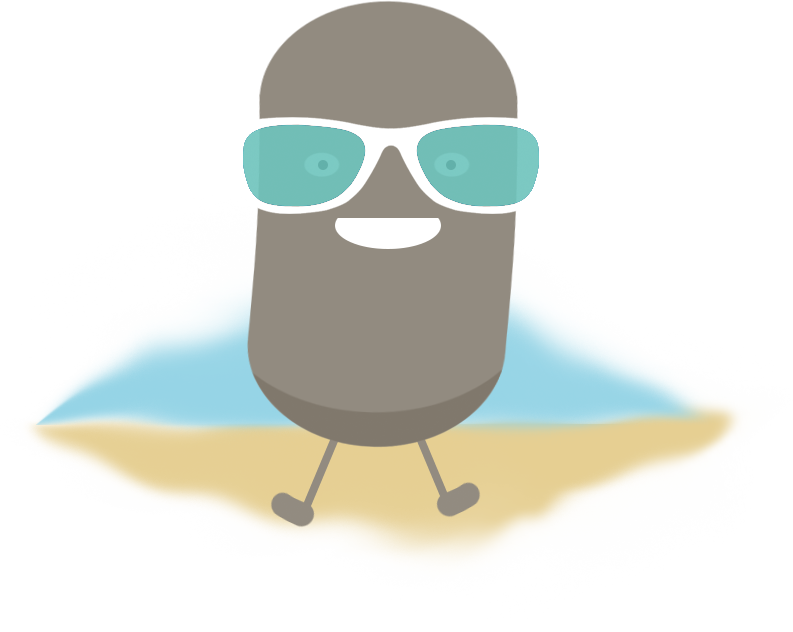
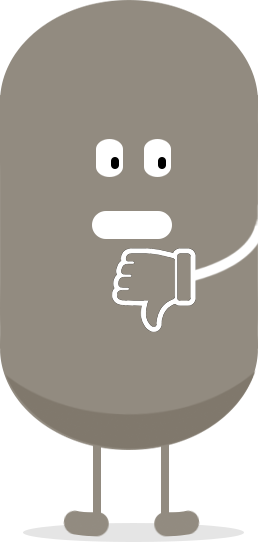
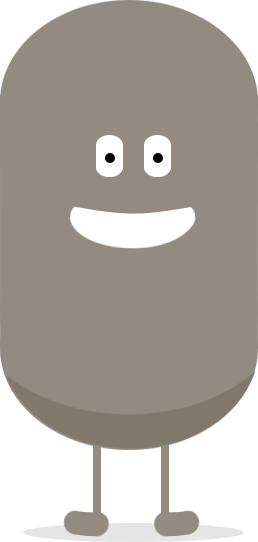
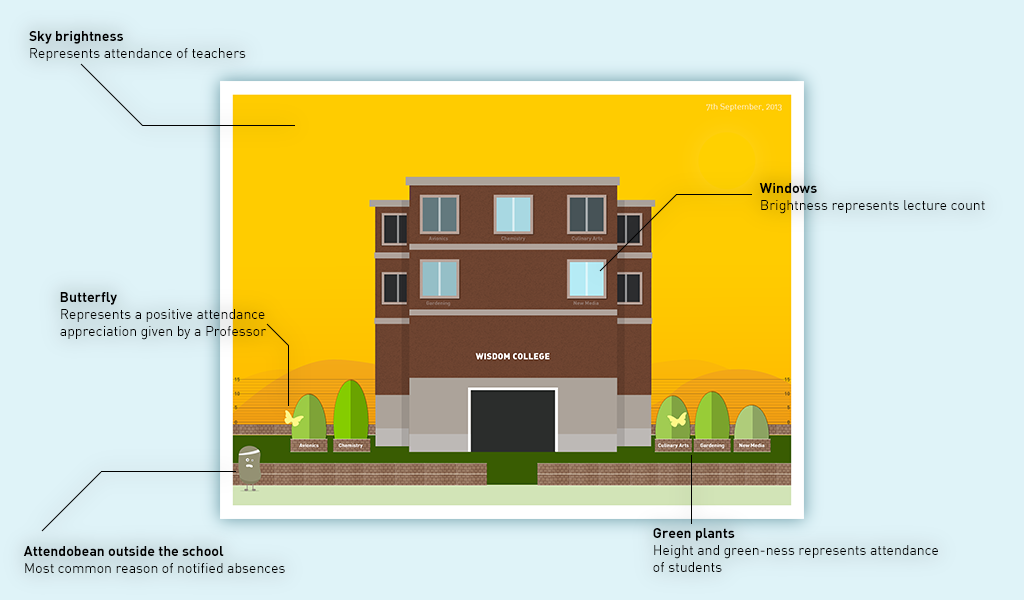
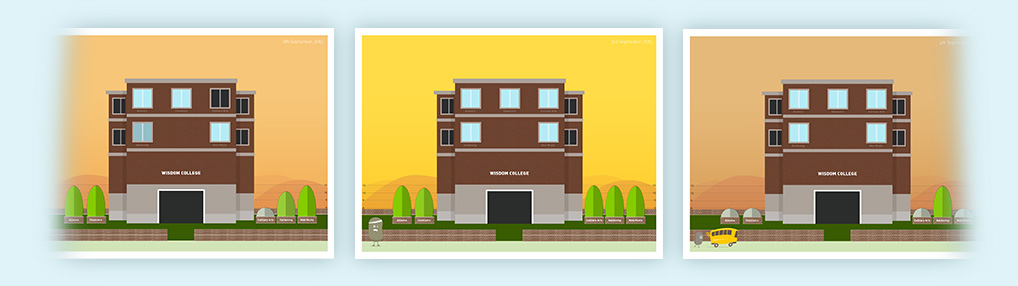
After seeing the prototype in action, it was observed that just colour-based indications and buzzer beeps were not sufficient. It also did not provide an easy way to update timings for the next lecture. I also observed and learnt through informal interviews that friends play an important role in deciding whether a class should be attended or not. I also read literature on Persuasive Design. I therefore decided to add information about a user's friends. It was deemed be an effective motivation. At this stage I also understood that the device needed to have a degree of fun and not be a bureaucratic and stern alarm clock that asks you to go and attend classes. Reading about Gamification thus happened. This was when the idea for Attendobean was conceived.

The challenge of finding who a user's friends could be solved sufficiently by employing trend analysis. The system could automatically observe which group of students generally attend and miss classes together. It wouldn't be hundred percent correct to call these users 'friends', but they would potentially demonstrated some kind of grouping. In an academic institution, this could be grouping based on locality of residence, mode of transport, academic performance, economic status, students' native language, or affinity.

The next class of prototypes were made using an iPod Touch running a custom HTML5 application powered by JavaScript. For the scope of a workable demonstration, the database of students, classes and professors was made using XML. A collection of XML files were referenced and updated to show class timings, presence/absence status, etc. The RFID reader was connected to the server through an application written in C++ that read data from the USB port and wrote to the same XML files. The touch screen, and iOS Safari allowed for some very interesting interactions. The final demonstration ran as a full screen web app. CSS3 allowed for some very engaging and meaningful interactions. Layers of information were translated to layers in the application that were revealed by slide, pinch and tap gestures. hammer.js was used to detect multitouch gestures.

Visualizing daily attendance

The idea was to put out a publicly accessible visualization of the daily school attendance. Since social media sites like Facebook are accessed by nearly all students and their parents these days, I imagined that the school could have a public Facebook profile of its own. This profile would post an infographic picture of attendance everyday. When students have a sense of contributing to the public image of their school, they would be more responsible in attending classes.

When changes in the infographic picture are seen over time, valuable trends might emerge. School administration may use these trends for planning. The schools can therefore, for example, arrange for better buses in the rainy season when students skip mostly because of missing transport facilities. Or in consultation with parents, it could arrange for interesting events in summers when students miss because they go out on out-of-schedule vacations.

Data visualization legend
Legend for the data visualization.
An example of trends view
Trends in attendance.
The project was fun to work on, and brought back fond memories of my Computer Science training. I also learnt how to use modern 3D interface effects like layers, shadows and animations to add meaning rather than fanciness.

Where to, from here?

I would now like to test the possibility of this being a phone application. For the age group that I'm targeting, I am speculating it might make sense to have all this on a smartphone. If it were to evolve in this form, it could use the modern BLE technology. It would allow for more reliable presence detection. It is used by Apple in its iBeacons positioning technology and by commercial products like the Estimote Beacons.

I would also like to test it on a bigger audience. The cost of producing this in this form, in the immediate future would be too high to be of practical use in large numbers. Another option that I would like to explore is to use e-paper displays which are compartively cheaper. In that case I would have to develop new interactions to use buttons and forego the multitouch gestures.